
SEBI's August 2026 Study: Why Most Option Traders Lose Money (With Charts)
By Investingg.in
The short answer
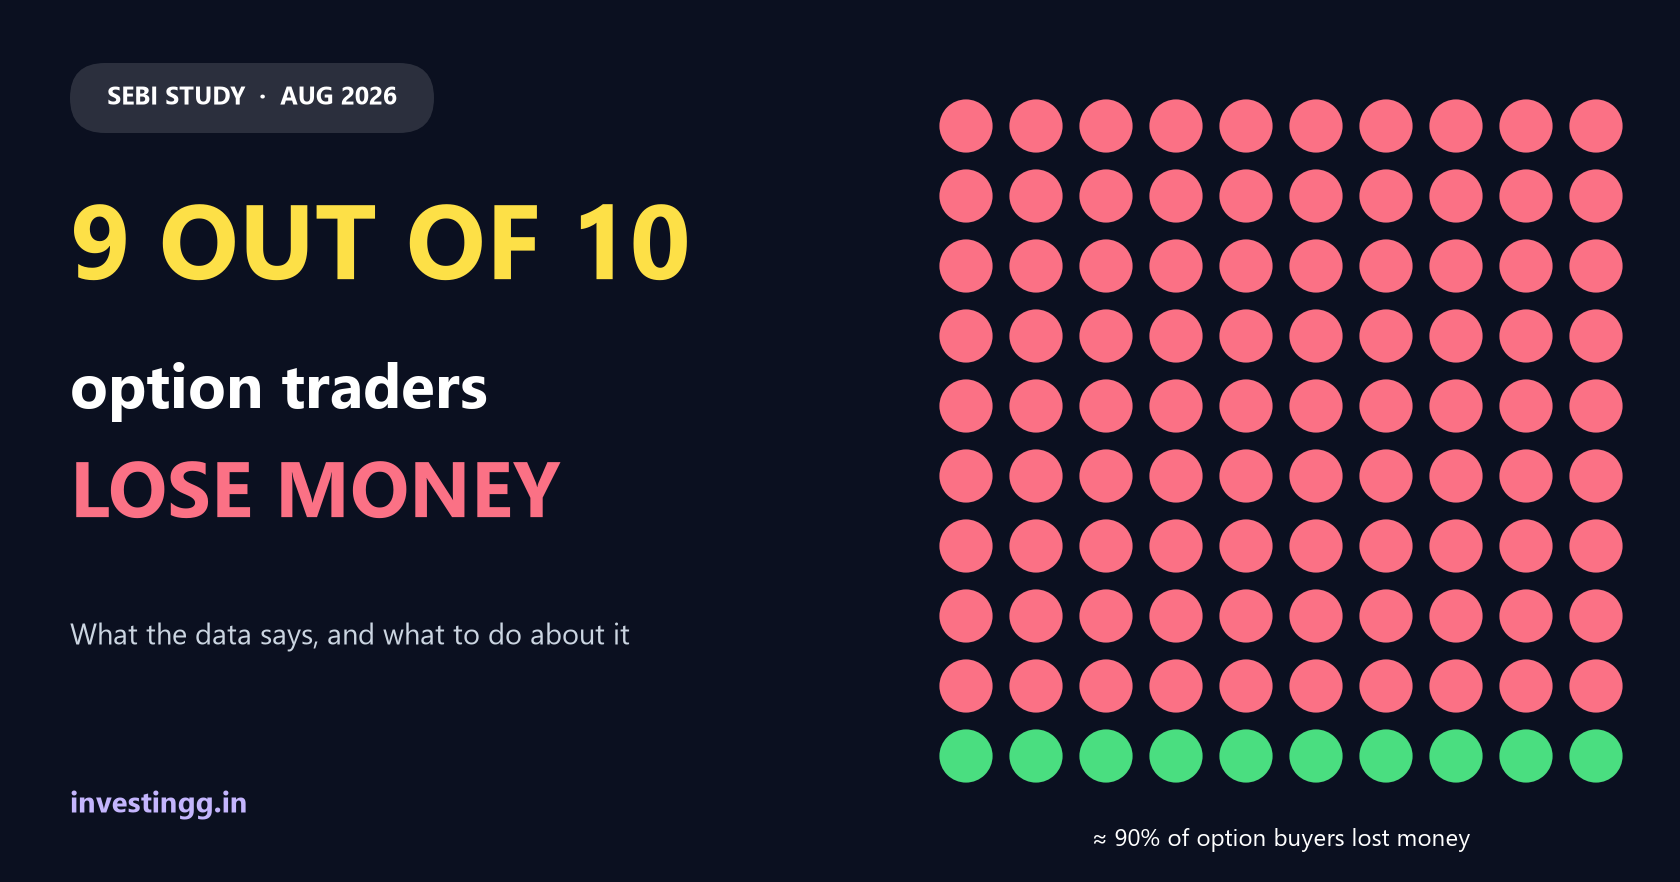
SEBI's August 2026 study (FY25 to FY26) found that about 90% of individual option buyers ended the year with a loss. More years of trading did not lower the odds (91% lost in year one, 96% by year three). Traders active on more than 100 days made up 42% of traders but 87% of the losses, and the typical losing quarter (₹10,525) was more than twice the typical winning quarter (₹4,366). The findings are sample-based and indicative, but the pattern is consistent: size, frequency and habits matter more than prediction.
Watch the video
What is this SEBI study, and how far can you trust it?
In August 2026, SEBI's Department of Economic and Policy Analysis published "Trading Behaviour of Individual Traders in the Equity Derivatives Segment (FY25-FY26)", a 53-page study of how individual traders actually behave in India's futures and options market. Earlier SEBI studies counted how many traders lost money. This one goes further and asks which strategies, capital sizes, habits and experience levels go with those losses.
Read the numbers with SEBI's own caution in mind. The strategy findings rest on a random sample of about 5,050 traders and are described as "only indicative". The study shows association, not cause, and "individual traders" includes retail and HNI traders, HUFs, NRIs and sole proprietorships. We quote it as SEBI's finding, never as a law of the market.
≈90%
of option buyers ended FY26 with a loss
97%
of traders were mostly option buyers
42% / 87%
of traders who traded 100+ days / of all losses
0.5%
were profitable in every one of five years
| Item | Detail |
|---|---|
| Publisher | SEBI, Department of Economic and Policy Analysis II (August 2026) |
| Period | FY25 and FY26, with a five-year cohort view (FY22 to FY26) |
| Sample | About 5,050 traders for the strategy section; some tables use smaller samples |
| Who is counted | Individual traders: retail, HNI, HUFs, NRIs, sole proprietorships |
| Main caveat | Indicative and sample-based. Association, not cause. |
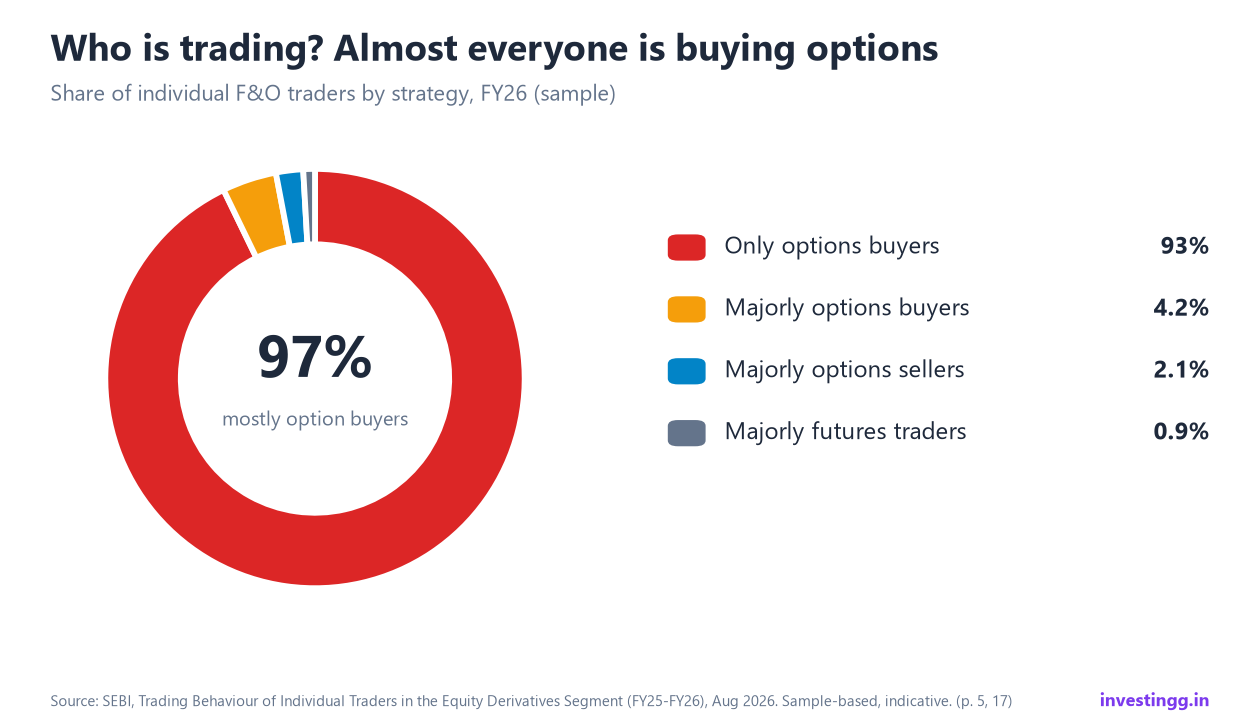
Who trades F&O? Almost everyone is buying options
In FY26, 93% of the traders in the sample were "only options buyers": they opened every position by buying an option. A further 4.2% were mostly buyers. Together, about 97% of individual F&O traders are on the buying side. Only about 2% were mostly option sellers, and fewer than 1% mostly traded futures.
Options-buying traders also accounted for the largest share of aggregate losses (55% to 65%, depending on the year) and the highest share of loss-makers.
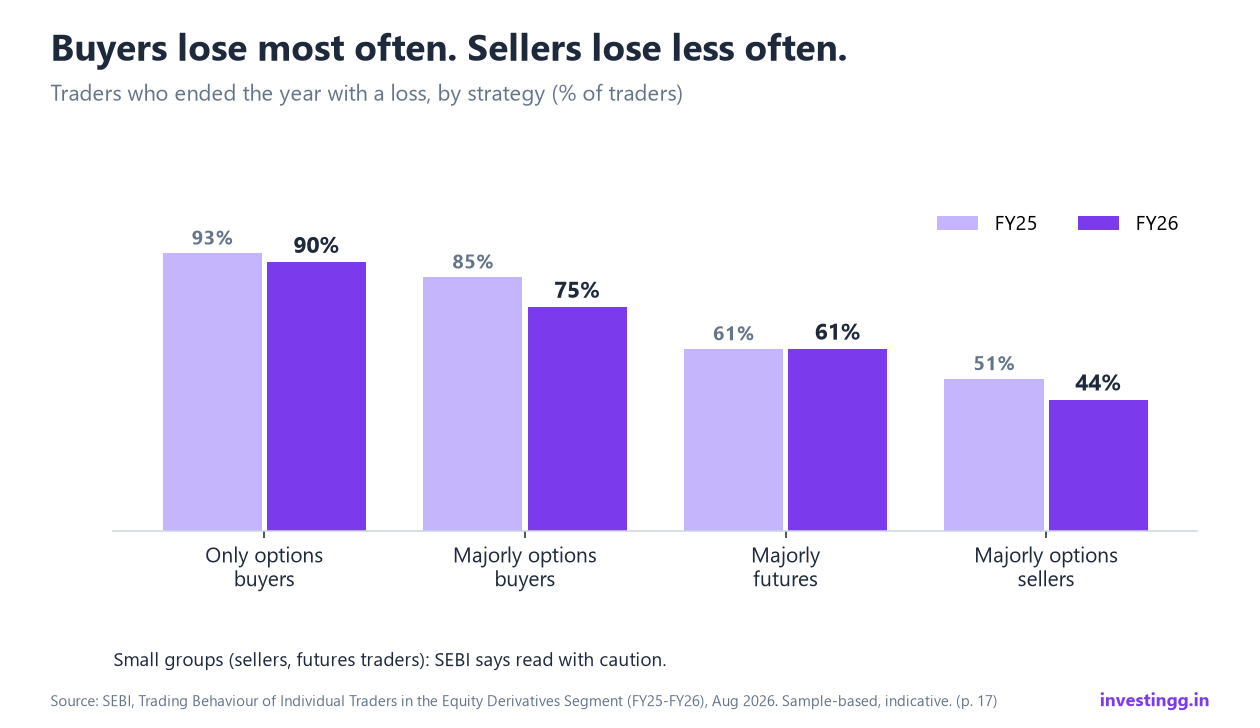
Buyers lose often. Sellers lose less often, but much bigger
About 90% of "only options buyers" ended FY26 with a loss, and 75% of the mostly-buyers did. Among mostly-option-sellers, 44% did (down from 51% in FY25), the lowest of any group.
That can look like a reason to sell options. SEBI's next finding is the catch. When a mostly-seller lost money, the average loss was about ₹51.7 lakh, roughly 11 times the mostly-buyers' ₹4.6 lakh and more than 30 times the ₹1.3 lakh of "only options buyers". As a group, option sellers lost ₹543 crore in FY26. High win frequency with rare, very large losses is the classic shape of short-option risk.
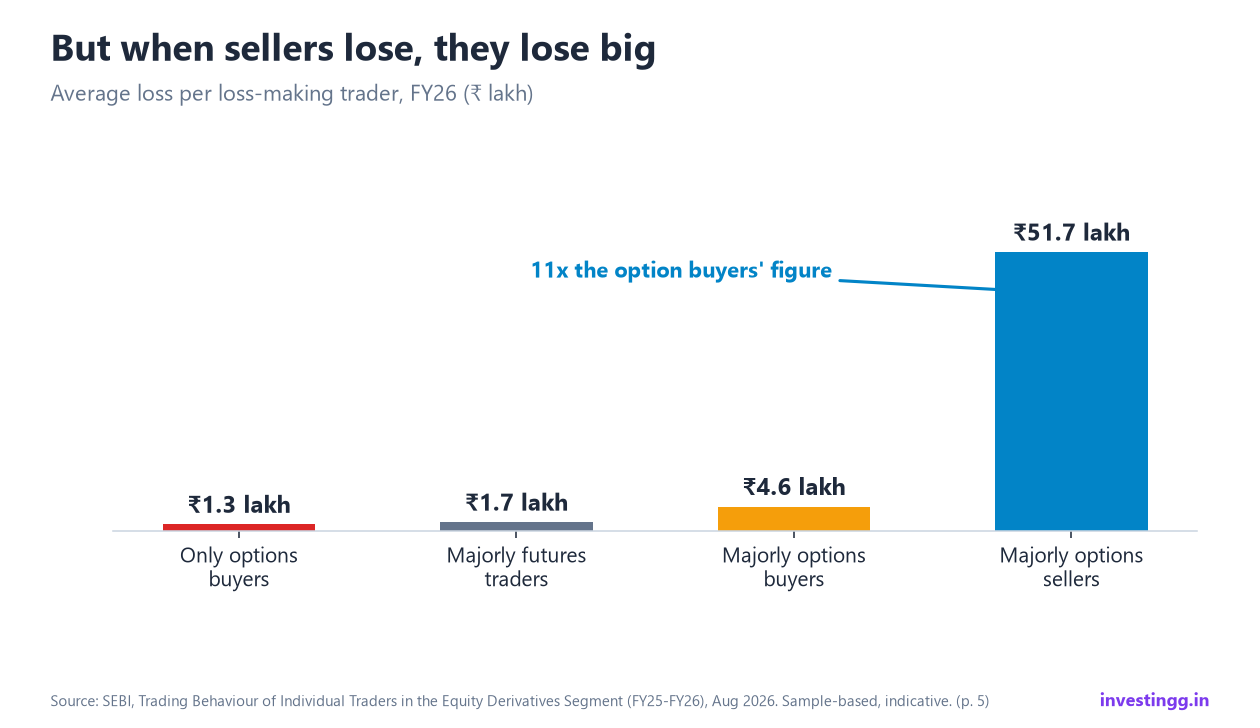
Why it matters for you: a strategy that wins often can still be dangerous if one loss is huge. Define the worst case before you enter, for example by adding a hedge leg or a fixed stop.
Small traders dominate the headcount. Larger traders dominate the losses
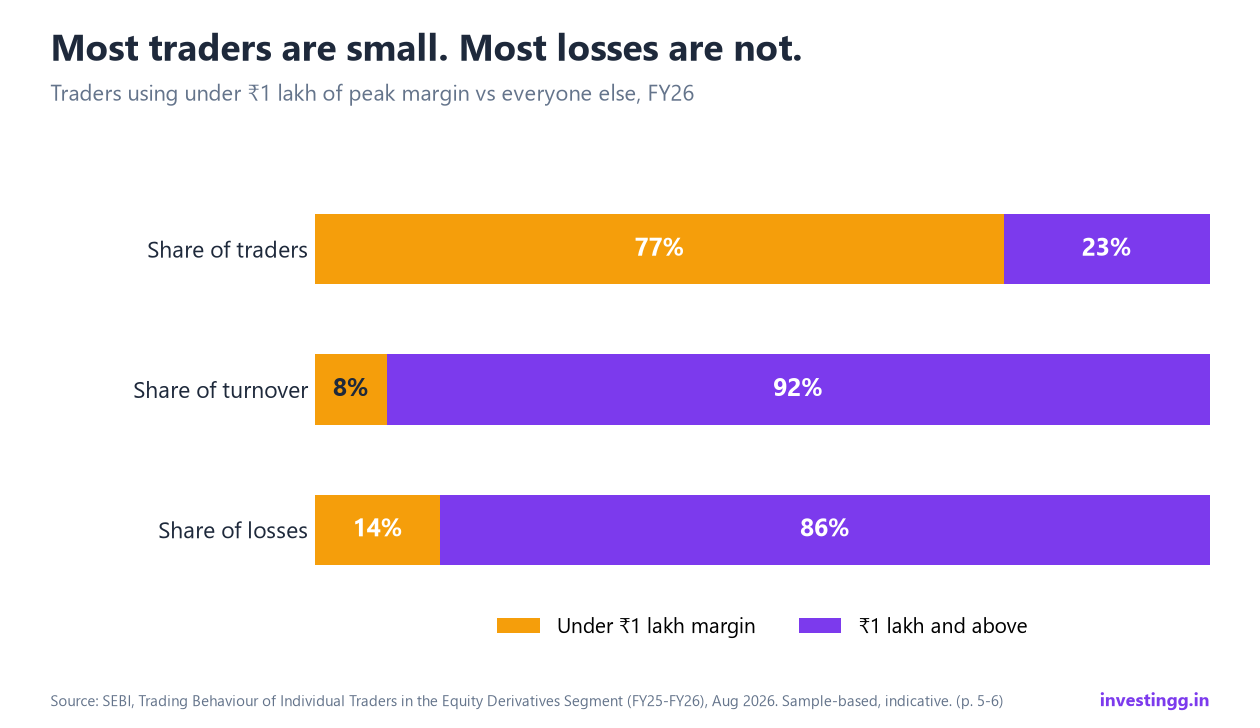
About 77% of traders used less than ₹1 lakh of peak margin, yet they accounted for only 8% of turnover and 14% of total losses. The remaining 23% of traders accounted for 92% of turnover and 86% of losses.
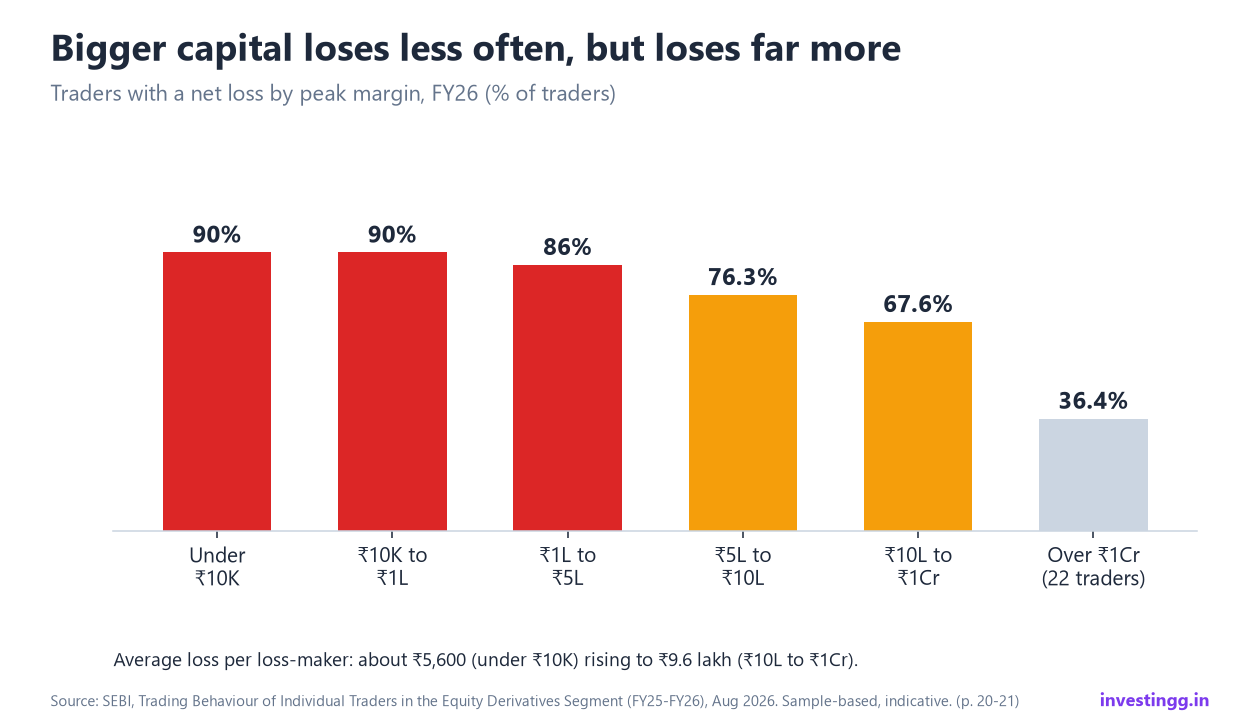
Bigger capital lost less often but lost much more when it lost. The share of loss-makers falls from 90% among traders with under ₹1 lakh of margin to 67.6% among those with ₹10 lakh to ₹1 crore, but the average loss per loss-maker rises from about ₹5,600 (under ₹10,000) to about ₹9.6 lakh. The over-₹1 crore group had only 22 traders, so ignore its bar.
More years of trading did not lower the odds of a loss
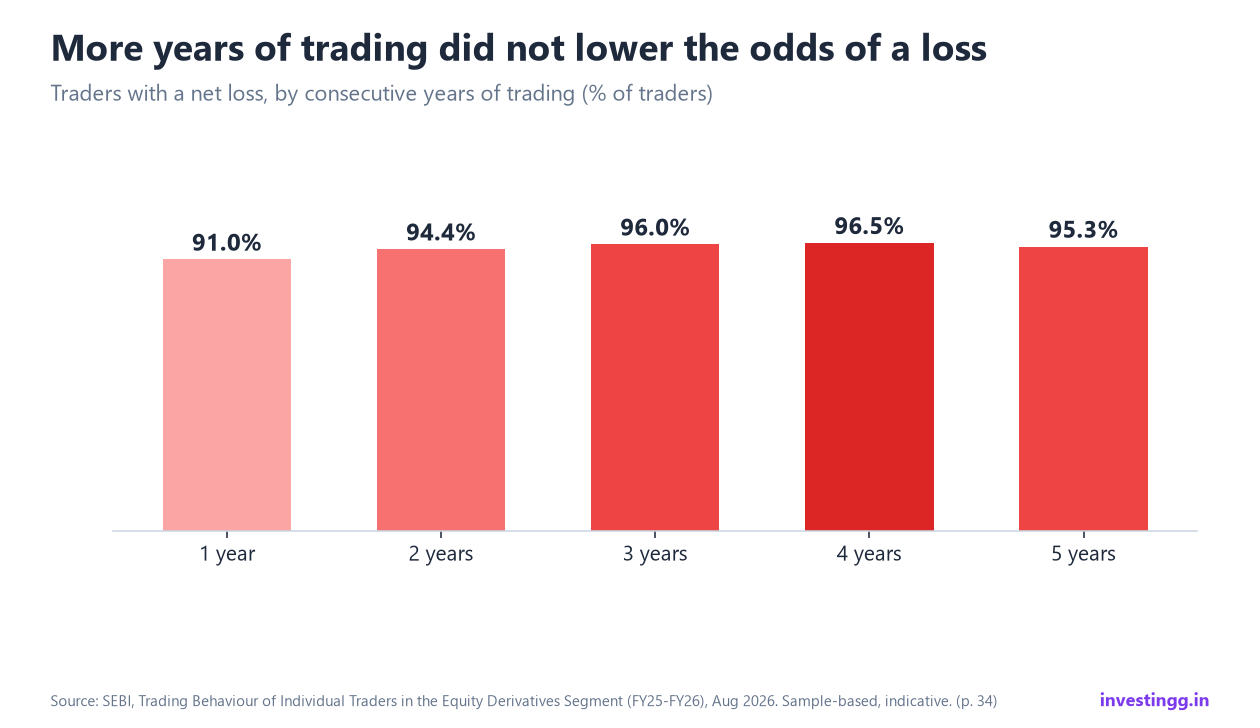
It is tempting to think experience fixes this. SEBI's data says otherwise. Among FY26 traders with one year of participation, 91.0% lost money. That rose to 94.4% for two years, 96.0% for three and 96.5% for four, then 95.3% for five. Loss-making shares stayed above 90% at every duration.
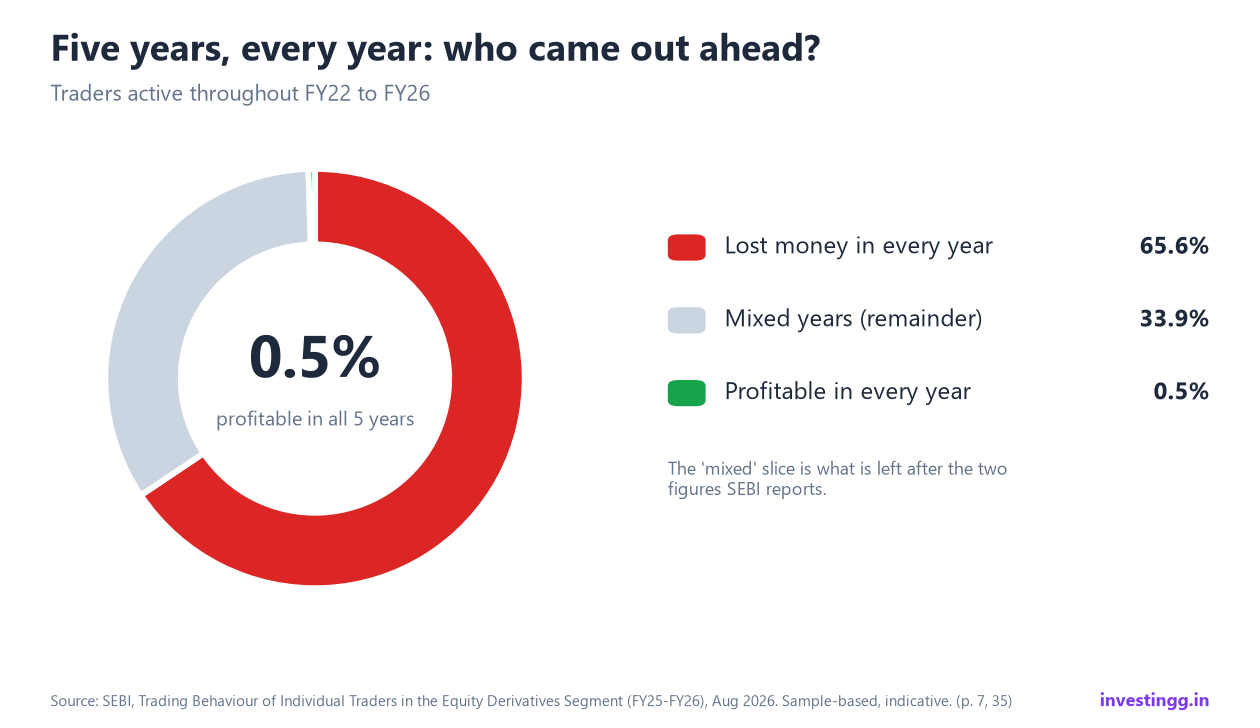
In the five-year cohort (traders active throughout FY22 to FY26), 65.6% lost money in every single year and only 0.5% were profitable in all five. SEBI adds that 90% to 92% of traders who lost in each of the two preceding years lost again the next year.
Time in the market is not the same as improving. Improvement comes from process: sizing, exits, and reviewing your own trades.
Trading on more days went with much bigger losses
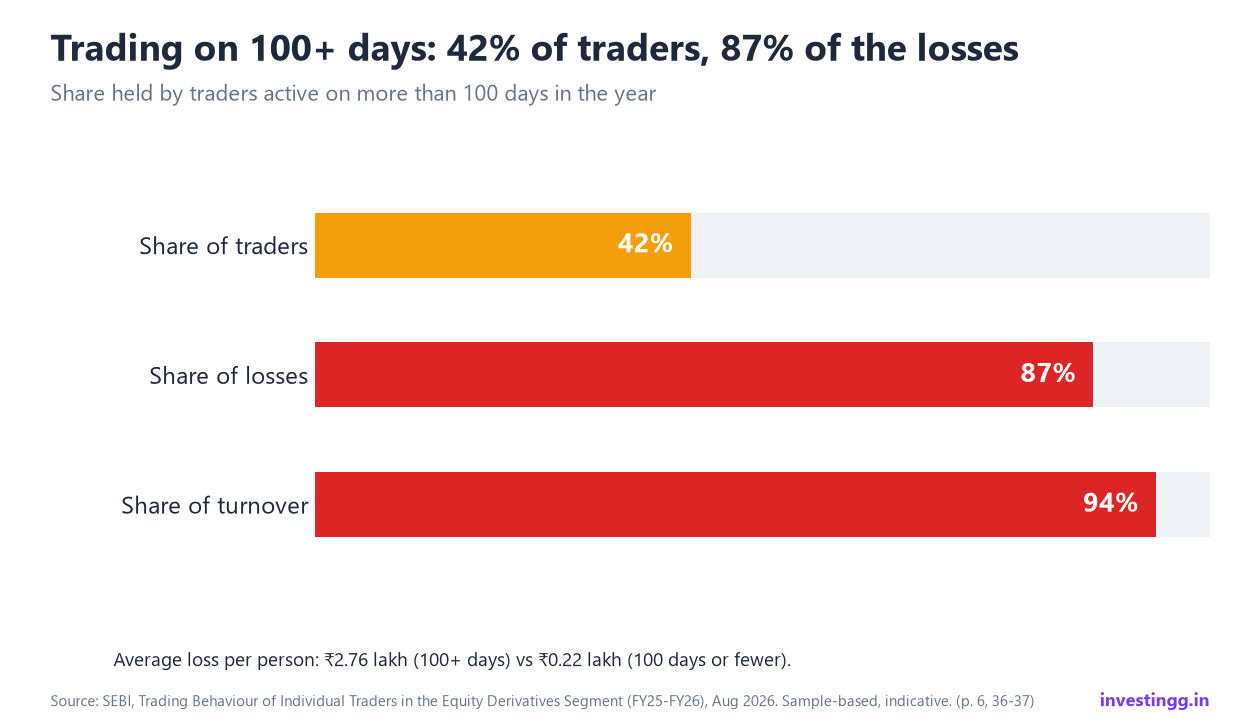
Traders active on more than 100 days in the year were 42% of traders but generated 94% of turnover and 87% of total losses. Their average loss was ₹2.76 lakh per person, against ₹0.22 lakh for those active on 100 days or fewer.
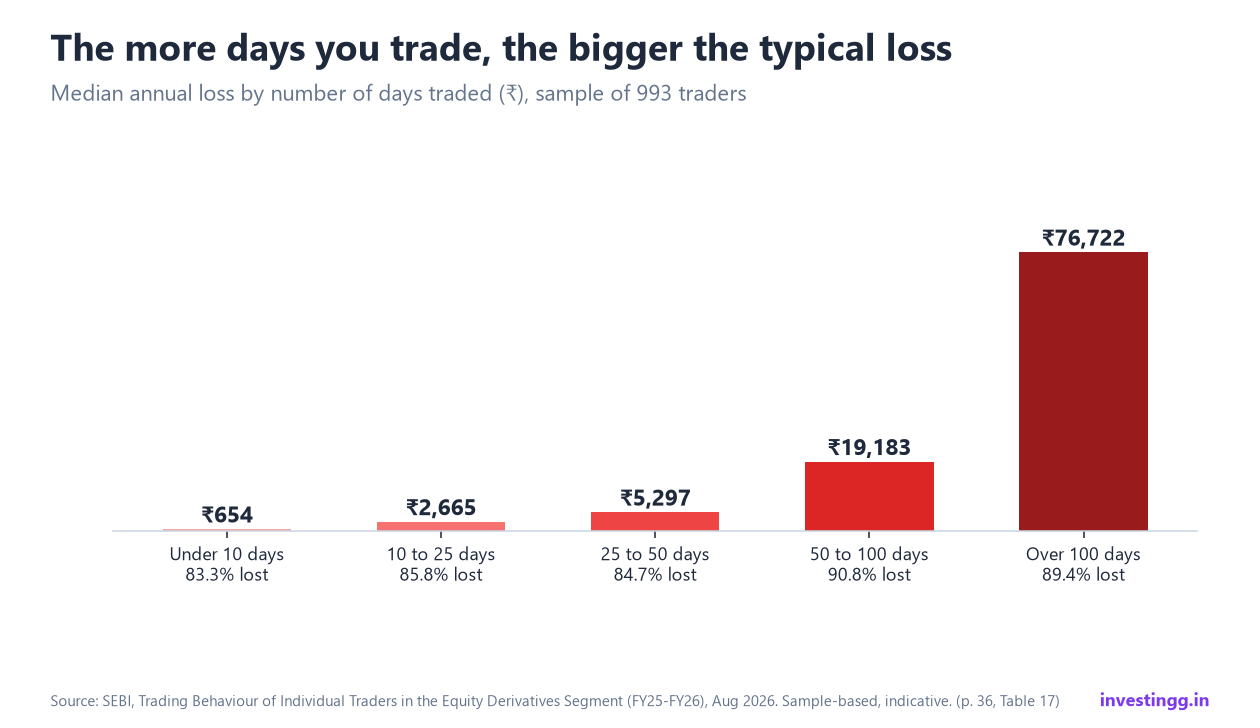
The table below shows the same pattern in medians. Within the SEBI sample, the median trader who traded fewer than 10 days lost ₹654 in the year; the median trader active on 100+ days lost ₹76,722. The share of loss-makers is high in every group (83% to 91%). What grows with frequency is the size of the loss.
| Days traded | Traders in sample | Median annual P&L | Share who lost |
|---|---|---|---|
| Under 10 | 84 | -₹654 | 83.3% |
| 10 to 25 | 127 | -₹2,665 | 85.8% |
| 25 to 50 | 150 | -₹5,297 | 84.7% |
| 50 to 100 | 218 | -₹19,183 | 90.8% |
| Over 100 | 414 | -₹76,722 | 89.4% |
Losses were bigger than gains, and most quarters lost
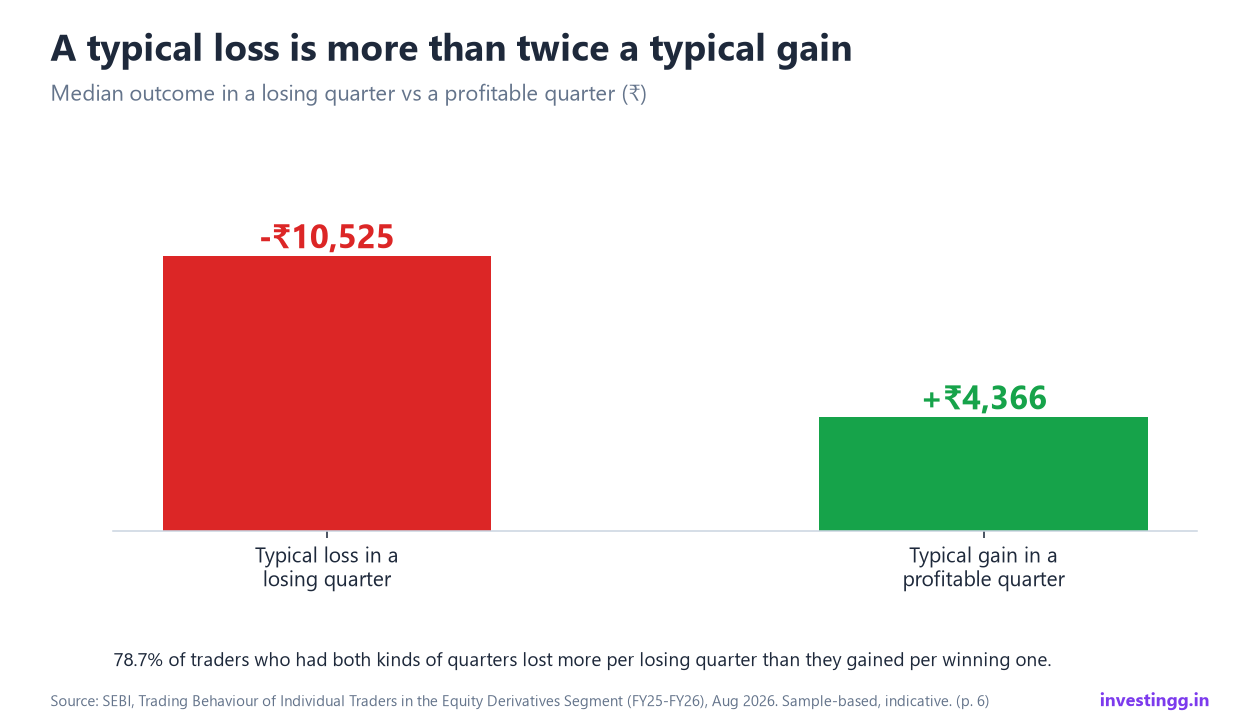
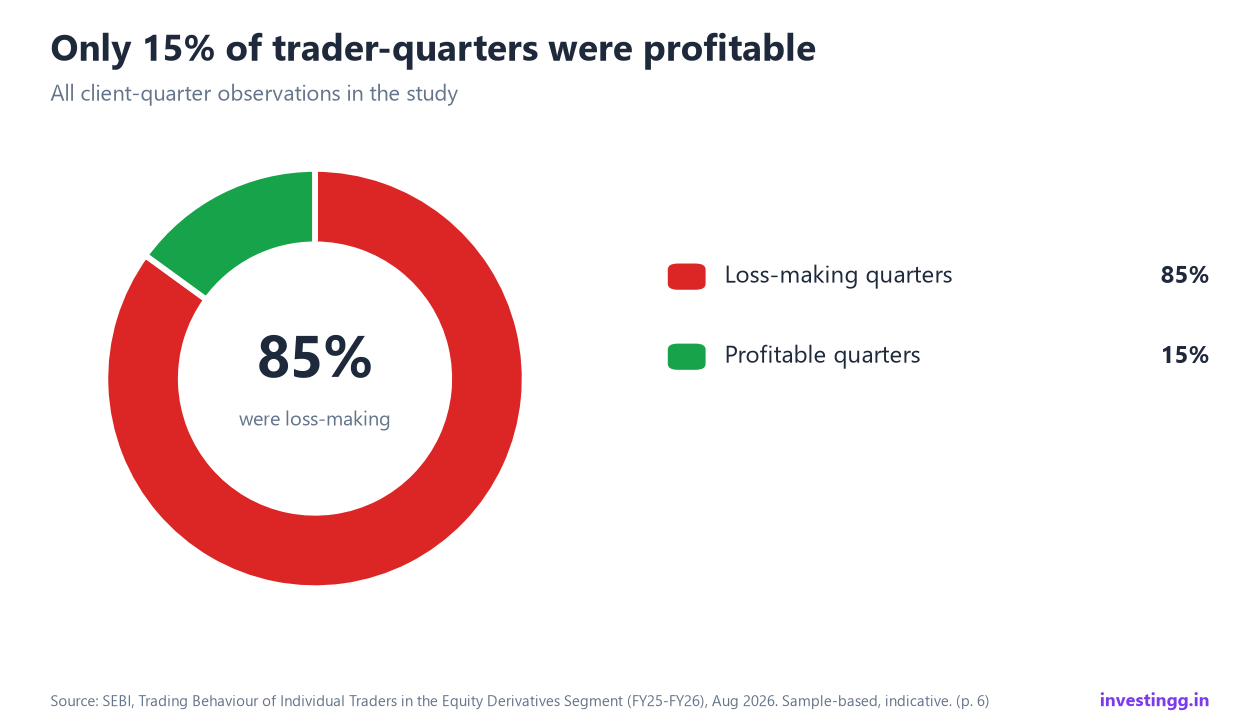
Only 15% of trader-quarters in SEBI's data were profitable; 85% were loss-making. The median loss in a losing quarter was ₹10,525, more than twice the median gain of ₹4,366 in a profitable quarter. Among traders who had both kinds of quarters, 78.7% lost more, on average, in their losing quarters than they gained in their winning ones.
SEBI also found that 86% to 89% of the traders who stopped trading had lost money in the quarter just before they left. Yet big past losses did not always end participation: traders with cumulative losses above ₹10 lakh continued at a rate of about 88%.
What the data suggests: four habits
None of the four habits below predicts the market. Each one answers a specific finding above. This is educational, not personal advice; the right numbers depend on your capital and risk tolerance.
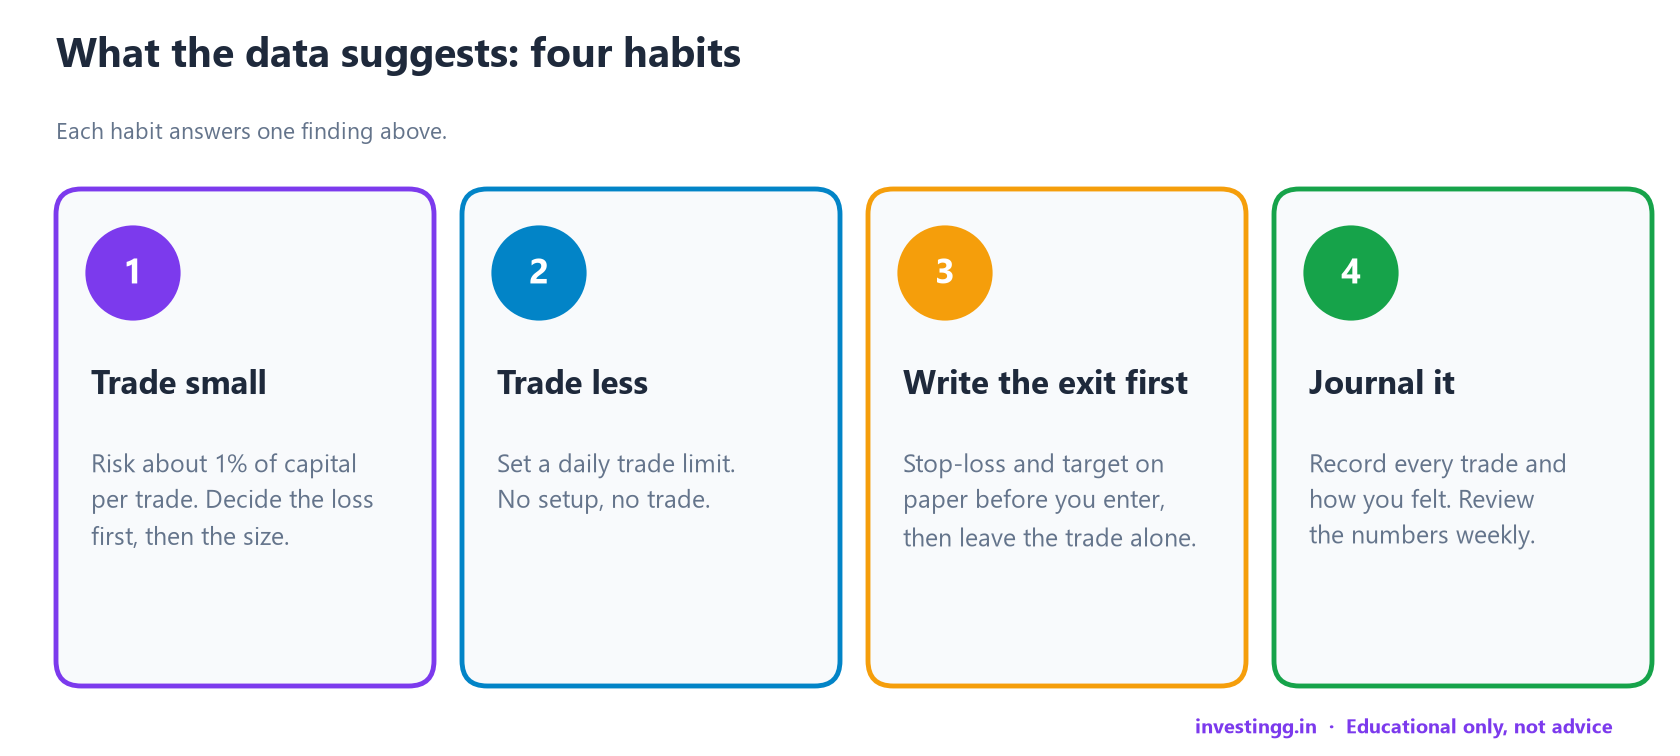
- Trade small. Many educators suggest risking a small, fixed fraction of capital, often around 1%, on each trade. Decide the rupee loss first, then let it set the size. With ₹2,00,000 and a 1% rule, the most you accept losing is ₹2,000. This answers the size and loss-magnitude findings.
- Trade less. Set a daily trade limit and follow it. No setup that meets your written rules means no trade. This answers the finding that the most active traders carried most of the losses.
- Write the exit first. Put the stop-loss and target on paper before you enter, then leave the trade alone. A stop-loss does not guarantee your exit price when a stock gaps, but it stops a loss from being open-ended. This answers the finding that typical losses were larger than typical gains.
- Journal every trade. Record the plan, the result and how you felt, and review the numbers weekly. This is how experience becomes learning, which the years-of-trading data suggests does not happen on its own. The investingg.in trade journal lets you import your tradebook and see your real P&L, win rate, profit factor and discipline feedback.
What this study does not tell you
- It does not say trading is impossible. It says most individual F&O traders in the sample lost money after costs.
- It does not prove that a habit causes better results. SEBI notes that the analysis shows association, not causation.
- It does not cover total household wealth. Other assets and liabilities are not captured.
- Its strategy findings come from a sample of about 5,050 traders, so treat them as indicative rather than exact.
- It is not a recommendation to buy or sell anything. Options trading involves a high risk of loss.
Source: SEBI, Department of Economic and Policy Analysis II, "Trading Behaviour of Individual Traders in the Equity Derivatives Segment (FY25-FY26)", August 2026. All figures in the charts above are taken from that report (executive summary pp. 5 to 8, strategy section p. 17, capital pp. 20 to 22, experience pp. 34 to 35, days traded pp. 36 to 37). The chart designs are ours.
Frequently asked questions
What did SEBI's 2026 study find about option traders?
In SEBI's FY26 sample, about 90% of individual option buyers ended the year with a net loss. Options buyers were about 97% of traders and carried the largest share of aggregate losses. The findings are sample-based and indicative.
Do option sellers do better than option buyers?
Fewer of them lose (44% in FY26 against about 90% for buyers), but when they do lose the average loss was about ₹51.7 lakh in SEBI's sample, roughly 11 times the mostly-buyers' figure. As a group, sellers still lost ₹543 crore in FY26. Frequent small wins can hide rare, very large losses.
Does trading experience improve results?
Not in this data. The share of loss-makers rose from about 91% in the first year to over 95% for traders with four or more consecutive years, and only about 0.5% of five-year traders were profitable in every year. Experience helps only if it is paired with rules and honest review.
Does trading more often lose more money?
In SEBI's sample, traders active on more than 100 days were 42% of traders but accounted for 87% of total losses and 94% of turnover. The median annual loss rose from ₹654 for under 10 trading days to ₹76,722 for over 100 days.
How can I trade more safely, based on this data?
Educational takeaways: risk a small fixed fraction of capital per trade, set a daily trade limit, write the stop-loss and target before entering, and journal every trade. None of this guarantees profit, and it is not personal advice.
Where can I read the SEBI study?
It is published by SEBI's Department of Economic and Policy Analysis II under the title "Trading Behaviour of Individual Traders in the Equity Derivatives Segment (FY25-FY26)", dated August 2026. Search for that title on sebi.gov.in.
The data does not say trading is impossible. It says most people trade too big, too often and without written rules. Fix those three things and you are no longer average.
The ebook
The Disciplined Trader's Playbook
By Deb Kumar Ghosal · 74 pages · ₹99
See what is inside →
Knowing is half the game
Turn discipline into a repeatable process
Journal every trade, see your real win rate and profit factor, and get discipline feedback that tells you when you're slipping — free on investingg.in.
More from the blog
Disclaimer: This content is for educational purposes only and should not be considered investment or trading advice. Trading involves risk of loss. Please consult your financial advisor before making investment decisions.